
Real Examples (Band 9 / Band 8 / Band 7 / Band 6)
Band 9 Example - (Pie Chart)
You should spend about 20 minutes on this task.
Summarise the information by selecting and reporting the main features, and make comparisons where relevant.
Write at least 150 words.

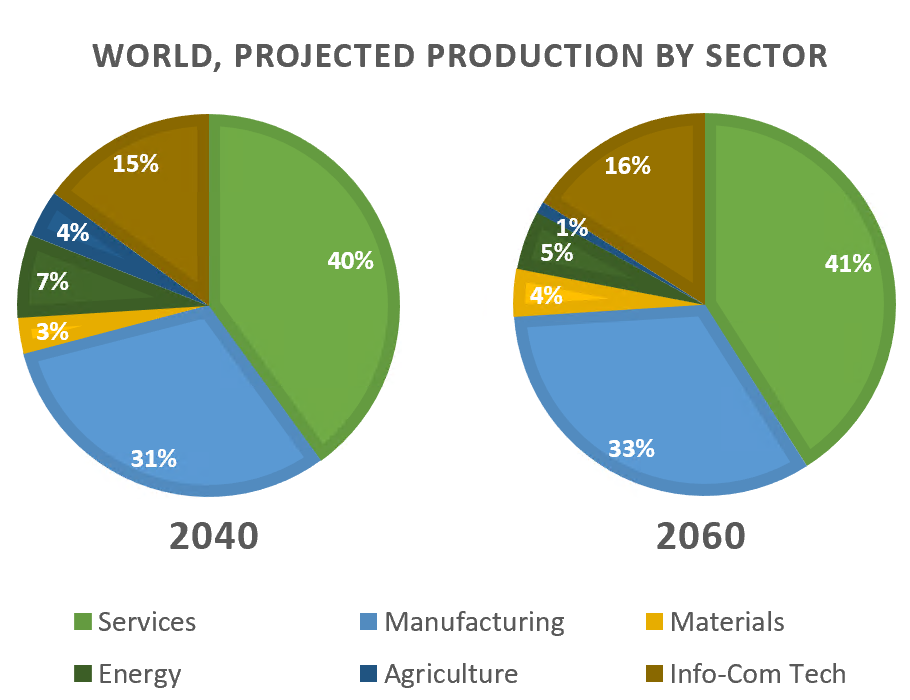
The two pie charts show the world projected production of six different sectors of the economy in 2040 and 2060. Overall, in the two time periods studied production will remain largely the same with only some slight variations.
There are only small changes occuring in the sizes of the manufacturing, services and info-com tech sectors between 2040 and 2060. In 2040, manufacturing will form 31% of the economic pie but this will only rise slightly to 33% of the total by 2060. Services will also only grow slowly from 40% to 41%. Leaving Info-Com which will also only expand slightly by just 1% from 15% to 16%.
The changes for the other three sectors are more striking. Agriculture will shrink from a tiny 4% in 2040 to just 1% in 2060, making up barely any of the total. Energy will grow slightly from 5% to 7% and materials will also experience only a slight expansion from 3% to 4% by 2060.
Band 8 Example - (Pie Chart)
You should spend about 20 minutes on this task.
Summarise the information by selecting and reporting the main features, and make comparisons where relevant.
Write at least 150 words.
The two pie charts show the world projected production of six different sectors in 2040 and 2060. Overall, in the two time periods studied production will remain static.
There are only small changes occuring in the sizes of three sectors. In 2040, manufacturing will form 31% of the economic pie but this will only expand slightly to 33% of the total by 2060. Services will also only grow slowly from 40% to 41%. Leaving Info-Com which will also only expand slightly by just 1% from 15% to 16%.
The changes for the other three sectors are more. Agriculture will shrink from 4% in 2040 to just 1% in 2060, making up barely any of the total. Energy will grow slightly from 5% to 7% and materials will also experience only a slight expansion from 3% to 4% by 2060.
Band 7 Example - (Pie Chart)
You should spend about 20 minutes on this task.
Summarise the information by selecting and reporting the main features, and make comparisons where relevant.
Write at least 150 words.

The two pie charts show the world projected production of six different sectors in 2040 and 2060. Overall, in the two time periods studied production will remain the same.
In 2040, manufacturing will forming 31% of the economic pie but this will only expand slightly to 33% of the total by 2060. Services will also only grow slowly from 40% to 41%. Leaving Info-Com which will also only increase slightly by just 1% from 15% to 16%.
The changes for the other three sectors are more. Agriculture will decreases from 4% in 2040 to just 1% in 2060, making up barely any of the total. Energy will grow from 5% to 7% and materials will also experience only a slight expansion from 3% to 4% by 2060.
Band 6 Example - (Pie Chart)
You should spend about 20 minutes on this task.
Summarise the information by selecting and reporting the main features, and make comparisons where relevant.
Write at least 150 words.

The two pie charts show the world projected production of six different sectors in 2040 and 2060. Overall, in the two time periods studied production will remain the same.
In 2040, manufacture will forming 31% of the economic pie but this will only expand slightly to 33% of the total by 2060. Leaving Info-Com which will also only increase slightly by just 1% from 15% to 16%. This will leave the other two an increasing trend.
The changing will for Agriculture will decreases from 4% in 2040 to just 1% in 2060 and will getting the bigger. Energy will increasing from 5% to 7% and materials will also experience only a slight expansion from 3% to 4% by 2060.
Band 5 Example - (Pie Chart)
You should spend about 20 minutes on this task.
Summarise the information by selecting and reporting the main features, and make comparisons where relevant.
Write at least 150 words.

The two pie charts show the world projected production of six different sectors in 2040 and 2060. Overall, in the two time periods studid production will remaining the same. In 2040, manufacture will forming 31% of the economic pie but this will only expand slightly to 33% of the total by 2060. Leaving Info-Com which will also only increase by just 1% from 15% to 16%. This will leaving the other two an increasing trend. The changing will for Agriculture will decreases from 4% in 2040 to just 1% in 2060 and will getting the bigger. Energy will increasing from 5% to 7% and the info-Com tech will continue the increasing trends.
Band 5 Example - (Pie Chart)
You should spend about 20 minutes on this task.
Summarise the information by selecting and reporting the main features, and make comparisons where relevant.
Write at least 150 words.
The two pie charts show the world projected production of six different sectors in 2040 and 2060. Overall, in the two time periods studid production will remaining the same. In 2040, manufacture will forming 31% of the economic pie but this will only expand slightly to 33% of the total by 2060. Leaving Info-Com which will also only increase by just 1% from 15% to 16%. This will leaving the other two an increasing trend. The changing will for Agriculture will decreases from 4% in 2040 to just 1% in 2060 and will getting the bigger. Energy will increasing from 5% to 7% and the info-Com tech will continue the increasing trends.