
How to write each section of your Task
A) Academic Task 1
Introduction
Key things to do
- Tell the examiner what the chart shows.>
- Describe every part of the chart.
- Tell the examiner what all the data points are.
- Try to write this in two or three sentences.
- Give an overview of the numbers.
Key things to do
- Describe all the data points.
- Describe the type + top + middle + bottom + left + right
Question
You should spend about 20 minutes on this task.
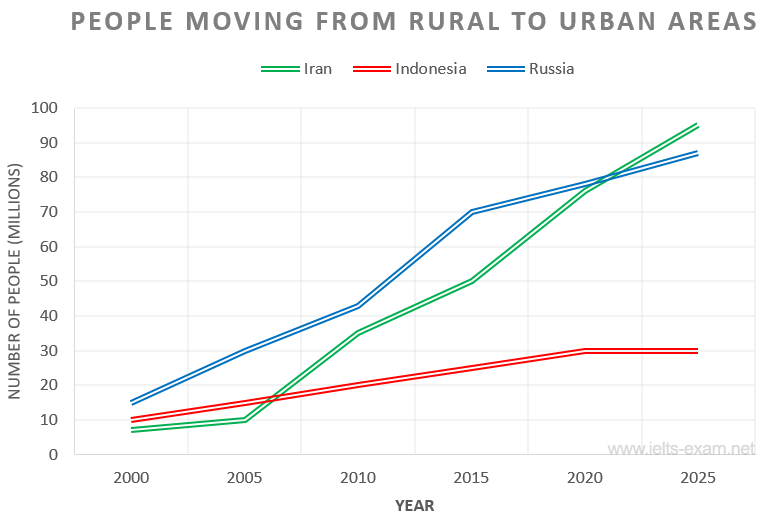
The chart below shows the movement of people from rural to urban areas in three countries and predictions for future years.
Summarise the information by selecting and reporting the main features, and make comparisons where relevant.
Write at least 150 words.
Good examples
- The line graph shows the figures in tens of millions for the migration of people from the countryside to cities in three different countries over the period 2000 to 2025 and includes future predictions.
- The line graph depicts the movement of people from rural to urban areas in tens of millions in three different countries over the period 2000 to 2025.
Bad examples
- The line graph is a showing a millions of the migration of the people from the country to a cities in some different country.
- The diagram depicts the travelling of citizens from countryside to downtown in third localities and predicts the future.
Overall Sentence (Sentences 2 / 3)
Key things
- Give a general description of how the numbers are changing.
- Don’t mention any specific numbers.
- If appropriate, communicate what the trend is over time.
- Try to make this one or two sentences.
Good examples
- Overall, it is clear that the shift from rural communities towards urban metropolitan areas is upwards.
- Overall, the number of people moving from rural to urban areas is increasing except in Indonesia where the rate of expansion will level off in 2020.
Bad examples
- A many people are moving to the urban from a countryside.
- Iran started at 8 million and then quickly grew to 38 million in 2010. This followed a rising trend of 50 million to finish at 98 million in 2025.
Finished Example (Introduction)
Finished Introduction (good example)
Background – The line graph shows the figures in millions for the migration of people from the countryside to cities in three different countries over the period 2000 to 2025, including future predictions. Overall – Overall, it is clear that the shift from rural communities towards urban metropolitan areas is upwards.
Finished Introduction (bad example)
Background – The line graph is a showing a millions of the migration of the people from the country to a cities in some different country. Overall – A many people are moving to the urban from a countryside.
B) General Task 1
How to write the start
Key things to do
- Tell the examiner what the chart shows.>
- Describe every part of the chart.
- Tell the examiner what all the data points are.
- Try to write this in two or three sentences.
- Give an overview of the numbers.
Key things to do
- Use formal language for a formal letter.
- Use informal language for an informal letter.
- Be careful with word choice and use an appropriate style.
- Connect your letter paragraphs with the prompts.
- Start your letter with the correct opening depending on the level of formality.
Opening
Check out the language section for examples of this.
Key things to do
- Start your letter with the correct degree of formality.
- Include a salutation.
Question
You should spend about 20 minutes on this task.
Write a letter to the taxi company. In your letter
- say why you are writing and how you feel
- explain what happened
- tell them what you would like them to do.
Good example
- Dear Sir or Madam
Bad example
- Hi Mrs Smith
- I am writing to you because I feel angry.
You should spend about 20 minutes on this task.
Write a letter to your friend. In your letter
- explain the important event
- apologise for the situation
- suggest a new arrangement
Good example
- Hi Susan
- I am really sorry about this.
Bad example
- Dear Susan
- I hope this letter finds you well.